Category A COE closed at S$139,001 in the first November bidding, the highest Category A price in records back to 2002. If your car can last another year or two, waiting for a cheaper certificate sounds sensible.
The question is what the wait is meant to deliver. A cheaper COE needs more certificates, weaker demand or a change in the rules. We checked all three. The evidence is strongest on supply, and supply has a timetable.
The short answer: unusually large groups of cars reach the end of their first COE between now and September 2029. That supports supply for roughly the next three years. After that, much smaller groups follow. Waiting past that point gives up the supply support. A recession could still bring prices down, but its timing is unknown.
Will COE prices drop in 2027?
Nobody can forecast COE prices, and we do not try. What the data can show is supply, and supply in 2027 does not point to a large drop on its own.
Under our reference case, where 45% of owners renew, Category A and B supply in 2027 runs at about 4,400 to 4,600 certificates a month. That is close to the 4,280 a month on offer now. If renewals stay near 2025’s level of about 31%, supply climbs to about 5,300 a month by January 2028, roughly a quarter more than now.
So the supply case for a lower price in 2027 rests on how many owners let their cars go. Demand and rules matter as much. LTA expects to report on the proposed merger of Categories A and B in the first half of 2027. That would shift costs between models, not add certificates.
The larger supply change comes after 2029, when smaller groups of cars reach ten. The supply paths are charted below, with every quarter’s numbers.
Where new COEs come from
A COE, or Certificate of Entitlement, is the right to own a car for ten years. You buy one at auction, in a monthly bidding exercise. Cars are split into Category A, for smaller and less powerful models, and Category B, for the rest.
Singapore has no growth in its car numbers until at least January 2028. So almost every new certificate replaces a car that has left the roads. The biggest single source is cars whose first COE ends, at about age ten.
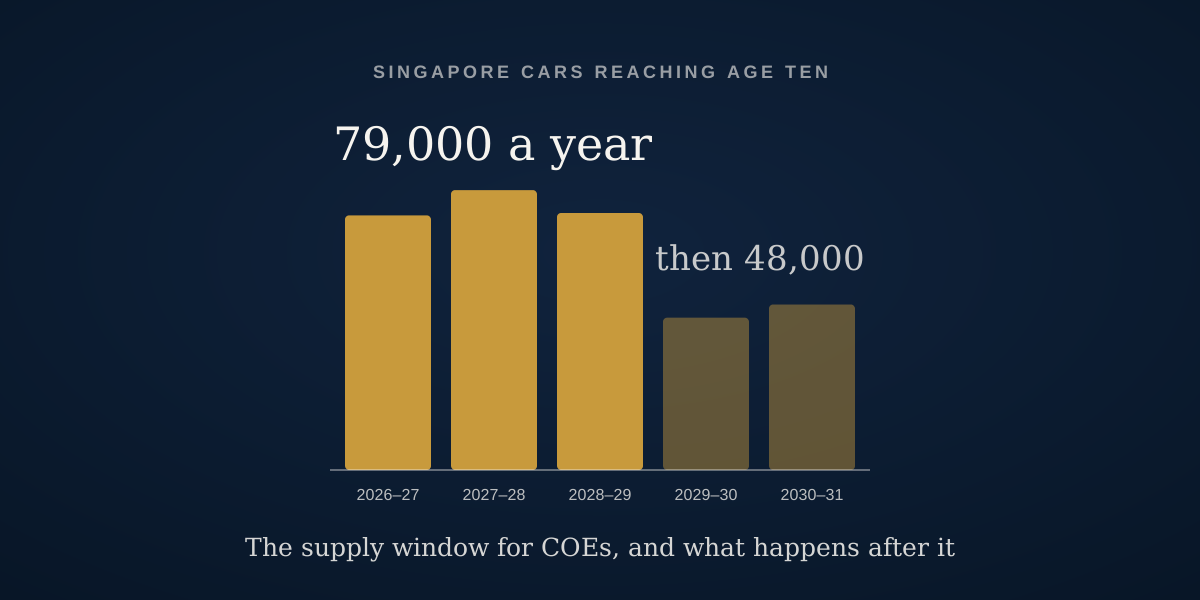
That makes the age of today’s cars a guide to future supply. LTA’s September age table shows how many cars will reach ten in each of the next five years.
About 40% fewer cars a year reach ten after September 2029. These cars are where most replacement COEs come from, but not every one becomes a certificate: owners renew, some cars leave early, and LTA adjusts the quota.
LTA monthly vehicle-age table at 30 September 2026, cars excluding tax-exempt and off-road vehicles, all COE categories combined. Today’s cars carried forward to age ten; cars that leave before then are not removed. The table cannot separate Category A from Category B. This is an age-group count, not a quota or price forecast.
a theenoughpoint.com toolThe next three groups average 79,149 cars a year. The two after that average 47,662, about 40% fewer.
Two cautions. Not every car reaching ten becomes a new certificate, because many owners renew. And the age table combines all categories, so it cannot show separate peaks for Category A and B.
In plain English: there is a three-year stretch of unusually large replacement supply, and then a smaller one.
More certificates have usually meant cheaper COEs
This is the pattern that makes the age table matter. The chart below puts twenty-four years of COE prices above the number of certificates offered.
Price · S$ per COE, monthly average
Supply · Category A+B certificates a month, 3-month average
- February 2013: MAS caps car loans (amount and tenure).
- April to June 2020: no bidding during the circuit breaker; the lines break.
- September 2025: LTA announces smaller EV tax incentives from 2026, and says it expects a short-term rise in COE prices.
In 2007 Categories A and B offered about 6,900 certificates a month, and a Category A COE averaged S$14,101. By 2013 supply was about 1,400 a month and the average was S$74,690. Supply was not the only force: loan limits, the 2008 crash and policy deadlines moved prices too.
Show the numbers: yearly averages
| Year | Cat A, S$ | Cat B, S$ | A+B a month |
|---|---|---|---|
| 2002 (Apr–Dec) | 31,294 | 32,204 | 3,511 |
| 2003 | 28,755 | 28,618 | 4,940 |
| 2004 | 25,181 | 25,203 | 6,244 |
| 2005 | 16,551 | 15,709 | 7,188 |
| 2006 | 11,187 | 12,430 | 7,314 |
| 2007 | 14,101 | 15,936 | 6,937 |
| 2008 | 12,330 | 13,412 | 6,295 |
| 2009 | 11,600 | 12,412 | 4,575 |
| 2010 | 30,405 | 39,834 | 2,722 |
| 2011 | 48,206 | 64,938 | 1,891 |
| 2012 | 63,898 | 84,431 | 1,780 |
| 2013 | 74,690 | 78,712 | 1,397 |
| 2014 | 67,675 | 73,282 | 1,953 |
| 2015 | 60,601 | 66,851 | 4,537 |
| 2016 | 49,587 | 52,122 | 6,675 |
| 2017 | 45,991 | 51,800 | 6,429 |
| 2018 | 33,038 | 35,345 | 5,865 |
| 2019 | 29,907 | 38,815 | 4,983 |
| 2020 (no bidding Apr–Jun) | 35,404 | 38,155 | 4,041 |
| 2021 | 47,425 | 61,222 | 3,250 |
| 2022 | 75,809 | 100,947 | 2,112 |
| 2023 | 94,538 | 121,801 | 2,236 |
| 2024 | 90,495 | 103,730 | 3,299 |
| 2025 | 102,912 | 120,748 | 3,996 |
| 2026 (Jan–Oct) | 120,931 | 124,306 | 4,232 |
Our computation from LTA bidding results: data.gov.sg for 2010 onwards, LTA archive tables for 2002 to 2009. Monthly price is the average of that month’s exercises. Category definitions changed over the period; older Category A results also covered taxis. Event markers show timing only and do not measure an effect.
a theenoughpoint.com toolSupply fell from 2007 to 2013 while prices climbed. When supply recovered in 2016 to 2019, prices fell back.
Was the 2008 crash doing all the work? It was not. Over any twelve months in which supply rose, COE prices tended to fall. When supply fell, prices tended to rise. The pattern holds for both categories, with or without the 2008 to 2010 crisis, and in the years since 2012.
The link is loose, though. In 2025, supply rose and prices rose too. Loan limits, EV incentives and buyers rushing before rule changes all move prices as well. Supply is one force among several.
How many certificates could come back?
Here is where renewals decide the answer. An owner who renews keeps the car, and that car’s deregistration does not feed new supply.
We do not know how many owners will renew. LTA does not publish a renewal rate for cars reaching ten. We estimated one from the age tables: the share of nine-year-old cars still registered a year later, after passing ten. Between 2016 and 2025 it ranged from about 27% to 60%. The yearly median was 44.6%. In 2025 it was 30.8%.
So we ran three paths, with 30%, 45% and 60% of owners renewing. Everything else stays the same in all three.
- In November 2028 to January 2029, when the largest age group feeds through, the scenarios give about 5,700, 4,700 and 3,800 certificates a month if 30%, 45% or 60% of owners renew.
- Wider historical assumptions reach about 7,000. Higher levels are still possible if more older cars leave or LTA releases extra supply.
Until late 2029 the paths run from a little below today’s supply to about a third above it, depending on how many owners renew. All of them fall in 2030 as the smaller age groups arrive. The blue line is a reference, not a forecast: 45% is close to the past median, but 2025 was nearer 31%.
Show the numbers: every quota quarter
| Quarter | 30% | 45% | 60% | Wider |
|---|---|---|---|---|
| Nov 2026–Jan 2027 | Announced by LTA: 4,280 | |||
| Feb–Apr 2027 | 4,700 | 4,500 | 4,300 | 4,000–5,400 |
| May–Jul 2027 | 5,000 | 4,600 | 4,100 | 3,600–5,900 |
| Aug–Oct 2027 | 5,100 | 4,400 | 3,800 | 3,000–6,200 |
| Nov 2027–Jan 2028 | 5,300 | 4,400 | 3,600 | 2,500–6,600 |
| Feb–Apr 2028 | 5,400 | 4,500 | 3,600 | 2,600–6,700 |
| May–Jul 2028 | 5,500 | 4,600 | 3,700 | 2,700–6,800 |
| Aug–Oct 2028 | 5,600 | 4,600 | 3,700 | 2,700–6,900 |
| Nov 2028–Jan 2029 | 5,700 | 4,700 | 3,800 | 2,800–7,000 |
| Feb–Apr 2029 | 5,600 | 4,700 | 3,700 | 2,700–7,000 |
| May–Jul 2029 | 5,500 | 4,600 | 3,700 | 2,700–6,900 |
| Aug–Oct 2029 | 5,400 | 4,500 | 3,600 | 2,600–6,800 |
| Nov 2029–Jan 2030 | 5,300 | 4,400 | 3,600 | 2,600–6,700 |
| Feb–Apr 2030 | 4,900 | 4,100 | 3,300 | 2,300–6,200 |
| May–Jul 2030 | 4,500 | 3,800 | 3,100 | 2,100–5,800 |
| Aug–Oct 2030 | 4,100 | 3,500 | 2,900 | 1,900–5,400 |
| Nov 2030–Jan 2031 | 3,700 | 3,100 | 2,600 | 1,600–4,900 |
| Feb–Apr 2031 | 3,700 | 3,200 | 2,700 | 1,700–5,000 |
| May–Jul 2031 | 3,800 | 3,200 | 2,700 | 1,700–5,100 |
| Aug–Oct 2031 | 3,800 | 3,300 | 2,700 | 1,700–5,100 |
| Nov 2031–Jan 2032 | 3,900 | 3,300 | 2,800 | 1,700–5,200 |
Our scenario arithmetic, not an LTA forecast. Each quota quarter uses the previous twelve months of modelled deregistrations, as LTA’s allocation does; about 10% goes to the open category. Shared inputs: about 23,000 other exits a year (2023–2025 average), 6,278 a year deducted for certificates LTA has already brought forward, no new injections, zero vehicle growth. The band crosses the 2016–2025 extremes of renewal and other exits with and without that deduction. History: data.gov.sg and LTA results; age groups: LTA table at 30 September 2026.
a theenoughpoint.com toolUnder the 45% reference, supply when the largest group feeds through is about 4,700 a month. That is only a little above the 4,280 a month LTA has announced for November 2026 to January 2027. With fewer renewals, at 30%, it is about 5,700. With more, at 60%, it is about 3,800.
Why so much lower than 2016, when supply reached about 7,400 a month? Three things differ. The group reaching ten in 2016 was bigger, about 108,000 cars against 84,000 in the largest group ahead. Only about 27% of those owners renewed, so roughly 79,000 cars left the roads. At 45% renewal, about 46,000 of the coming group would leave. And LTA now deducts about 6,300 certificates a year, because it released them early from 2023.
What would it take to get back to about 7,000 a month? Three things at once: renewals as low as 2016’s 27%, as many other cars leaving as in 2019, about 32,000, and no deduction for early releases. Each has happened in some year. They have not happened together. That combination is the top of the pale band. It is not a ceiling, and it is not a probability range. Going higher would also need LTA to release extra certificates.
Renewals cut both ways, though. A renewal holds a car out of the supply pipeline for five or ten more years. The Ministry of Transport has said that more renewals when prices are high would reduce the supply of new COEs. But a renewal can also remove a bidder: an owner who would otherwise scrap the car and buy a new one is not in the auction. So renewals cut supply and can also cut demand. Our supply paths do not estimate which effect is larger for prices.
In plain English: the large age groups mostly keep supply near today’s level for three years, unless far fewer owners renew. The clearer change is the drop after 2029.
Try your own renewal rate: a supply calculator

- Announced now
Nov 2026–Jan 20274,280 - Your assumption4,700
- Peak, Jul 20167,421
- Peak, Dec 20058,168
Formula: 90% of ((share not renewing × 83,984 cars) + other cars leaving − that deduction), divided by 12, plus 4. Defaults reproduce our 45% scenario. Past peaks are three-month averages of certificates offered. This is supply arithmetic under your assumptions, not a forecast of supply or prices. It leaves out any new LTA injections.
a theenoughpoint.com tool
Do job losses bring COE prices down?
Many buyers wait for a downturn, on the view that fewer people bid when jobs are scarce. We tested that against the Ministry of Manpower’s unemployment rate since 2002, and fixed the tests before running them.
Price · S$ per COE, quarterly average
Unemployment · % of the labour force, end of quarter, seasonally adjusted
- 2003: unemployment reaches 4.8%, the highest here. COE prices drift lower as more certificates come out.
- 2009: unemployment reaches 3.3%. Category A averages S$3,863 in the first quarter, then recovers while unemployment is still high.
- 2020: unemployment reaches 3.4%. COE prices rise, from S$32,875 for Category A in the first quarter to S$38,136 in the fourth.
Unemployment rose three times in these twenty-four years. Only in 2009 did COE prices fall sharply with it. In 2020 they rose, as fewer certificates came out.
Show the numbers: yearly figures
| Year | Cat A, S$ | Cat B, S$ | Jobless, % |
|---|---|---|---|
| 2002 (Apr–Dec) | 31,294 | 32,204 | 3.7 |
| 2003 | 28,755 | 28,618 | 4.8 |
| 2004 | 25,181 | 25,203 | 3.7 |
| 2005 | 16,551 | 15,709 | 3.3 |
| 2006 | 11,187 | 12,430 | 2.8 |
| 2007 | 14,101 | 15,936 | 2.7 |
| 2008 | 12,331 | 13,412 | 2.7 |
| 2009 | 11,600 | 12,413 | 3.3 |
| 2010 | 30,405 | 39,834 | 2.2 |
| 2011 | 48,206 | 64,938 | 2.1 |
| 2012 | 63,898 | 84,431 | 2.1 |
| 2013 | 74,690 | 78,712 | 2.0 |
| 2014 | 67,676 | 73,281 | 2.1 |
| 2015 | 60,601 | 66,851 | 2.0 |
| 2016 | 49,587 | 52,122 | 2.2 |
| 2017 | 45,991 | 51,800 | 2.3 |
| 2018 | 33,038 | 35,345 | 2.2 |
| 2019 | 29,907 | 38,815 | 2.3 |
| 2020 (no bidding Apr–Jun) | 35,404 | 38,155 | 3.4 |
| 2021 | 47,425 | 61,223 | 2.9 |
| 2022 | 75,809 | 100,947 | 2.2 |
| 2023 | 94,538 | 121,801 | 2.0 |
| 2024 | 90,495 | 103,730 | 2.0 |
| 2025 | 102,912 | 120,747 | 2.0 |
| 2026 (Jan–Sep) | 119,812 | 123,562 | 2.0 |
Unemployment: Ministry of Manpower, total unemployment rate, seasonally adjusted, end of quarter, from SingStat Table Builder, updated 30 October 2026. COE: our quarterly averages of LTA bidding results; no bidding in April to June 2020. Markers show timing only and do not measure an effect.
a theenoughpoint.com toolThe 2009 recession stands out. Unemployment rose to 3.3%, and Category A averaged S$3,863 in the first quarter of 2009. Over the whole period, years when unemployment rose tended to be years when COE prices fell. Take out 2008 to 2010 and that pattern mostly fades. Once the number of certificates is allowed for, what is left could be chance.
The timing does not help a waiting buyer either. A rise in unemployment did not come before falls in COE prices. In 2009, prices recovered while unemployment was still at its high. In 2020, unemployment rose to 3.4% and COE prices rose, as fewer certificates came out.
We ran similar tests on share prices, the STI and the S&P 500. Rallies were not a dependable signal either.
That does not mean jobs never matter. A deep shock to incomes and credit can cut demand, as 2009 showed. It means rising unemployment has not been a dependable signal to wait for.
Renew for five years, ten, or replace?
If your car is near ten, the price that matters most may be the renewal price, not the auction. Renewing does not involve bidding. The owner pays the Prevailing Quota Premium, or PQP: the average COE price of the previous three months with bidding. For November 2026 it is S$129,883 for Category A and S$131,819 for Category B.
Which month’s PQP you pay depends on timing. Renew in the month the COE expires, or up to a month late with a fee, and you pay that month’s PQP. Renew earlier and you pay the PQP of the month before expiry, and give up the unused part of the old COE.
PQP, the Prevailing Quota Premium, is the average COE price of the previous three months with bidding. A renewed car gets no PARF rebate when it is finally deregistered. Renewing before the expiry month forfeits the unused days. A late renewal is possible up to a month after expiry, with a fee. Source: LTA OneMotoring, COE renewal and PARF rebate pages, checked 5 November 2026. Company cars with a statutory lifespan are excluded.
a theenoughpoint.com toolThree things drive the comparison.
- Both renewals cost about 10% of the PQP for each year kept. Five years at half the PQP, or ten years at the full PQP.
- Renewing gives up the PARF rebate. A car reaching ten now is on a COE from before February 2023. Deregistered at nine to ten years, it returns 50% of the ARF it paid. A renewed car gets no PARF rebate at the end.
- The ten-year renewal needs twice the cash, but it can be repeated. If the car leaves before the ten years are up, the unused part of the PQP comes back as a COE rebate.
The calculator below sets the two renewals against buying a replacement, from your own figures.
- Renew for 10 years
cash now - Renew for 5 years
cash now - Replace the car
cash now
Cost per year kept, S$. Cash now for replacing is the price less the rebate on your current car.
Renewing: (PQP, or half of it for five years, plus the PARF rebate you give up, 50% of your ARF) spread over the years kept, plus extra repairs. Replacing: (all-in price less the new car’s rebate at ten, 5% of its ARF up to S$30,000) over ten years. Left out: interest, insurance, road tax, fuel, and any scrap or export value. A five-year renewal cannot be repeated, so at about fifteen the car must go. Arithmetic on your inputs, not a recommendation.
a theenoughpoint.com toolThe calculator also counts the replacement’s smaller rebate at the end. Cars on COEs from February 2026 get 5% of their ARF at nine to ten years, capped at S$30,000, against 50% for today’s ten-year-old cars. For an owner, the renewal price and the rebate rules can matter more than where the auction goes next.
Rules that move the bill
Three policy changes matter for the total cost, not only the COE.
- EV tax relief steps down. An electric car can get up to S$30,000 off its Additional Registration Fee (ARF) if registered in 2026, and up to S$20,000 in 2027. For a buyer who qualifies for the maximum, a COE would need to fall about S$10,000 just to offset that change.
- A smaller rebate at the end. Cars on COEs from February 2026 get a lower PARF rebate when deregistered: 30% of ARF in the first five years, falling to 5% in the tenth year, capped at S$30,000. That lowers what the car is worth when you let it go.
- A possible merger of Categories A and B. LTA has consulted on one passenger-car category, with a rebate or surcharge of up to S$15,000 by model. It is a proposal. LTA expects to share findings in the first half of 2027. It would not add certificates; it would shift costs between models. Whether it would touch renewals is undecided.
Private-hire cars owned by individuals have also faced the same loan limits as private cars since 30 October 2026. That may soften some demand. One bidding exercise since is too few to show any effect.
So, buy now or wait?
For someone already planning to buy, the supply case is strongest over roughly the next three years. Quotas stay supported by large groups of expiring cars into late 2029. After that, smaller groups follow, and supply in every path we ran falls through 2030.
That is a window, not a deadline. LTA’s quota uses a rolling year of deregistrations, so the change reaches auctions gradually. LTA can also bring supply forward, as it did with five-year renewals from May 2023. Those cars’ later exits are now deducted from current quotas, because their certificates were already issued. Further redistribution could make a later peak smaller and a later trough shallower.
It is also not a promise that earlier is cheaper. Under the 45% reference, supply over the window is close to today’s. Prices will depend on demand as much as on certificates. Waiting indefinitely for a lower COE, however, means waiting into years with less supply support.
Waiting for a recession is a different decision. A deep downturn could lower prices, as in 2008. Nobody knows when one will come. It may also hit your income or your access to a car loan. That is a bet on timing, and the supply evidence does not require it. The usual warning signs are a poor clock as well, as our test of rising interest rates since 1954 showed. Share investors face the same trade-off: the dip people wait for turns up about a third of the time.
The cheap, boring checks:
Set the all-in price you would accept. That is the COE, the car, the ARF after any EV relief, and the lower PARF value at the end. If you already own a car near ten, set it against the renewal price, which LTA publishes shortly before each month begins. If you wait, the car fund still needs a safe home: here is how T-bills, SSBs and cash accounts differ.
Watch the quarterly quota. LTA announces each quarter’s quota at the end of January, April, July and October. If the Category A and B numbers keep holding up or rising, the supply window is doing its work. The supply calculator under the scenario chart shows what different renewal rates would mean.
Decide what you would do if prices do not fall. If you would still buy, the question is only when within the window. If you would not, the decision is about the car, not the COE.
Where our numbers are soft
- The renewal share is a proxy. It compares cars aged ten with the same group a year earlier. Early exits, imported used cars and late renewals all blur it. It is not a measured probability of renewal.
- Other exits are a residual. We take total Category A and B deregistrations and subtract the estimated exits of cars reaching ten. What is left includes older cars, early exits and classification differences. We hold it at the 2023 to 2025 average of about 23,000 a year.
- The scenarios are mechanical. Each quota quarter uses the previous twelve months of modelled deregistrations, less the current yearly deduction for certificates released early (about 6,300), with about 10% going to the open category. Fed with actual deregistrations, the same formula reproduces LTA’s announced quota for November 2026 to January 2027. Future deductions, injections and any change to the five-year renewal are not known and are not included.
- The band is not a confidence interval. It crosses the lowest and highest historical renewal and other-exit values, with and without that deduction. These combinations never occurred together. Actual supply can fall outside it.
- The 2016 comparison mixes two tables. The 2016 group is cars aged nine at the end of 2015 in LTA’s annual age table. The coming groups come from its monthly table at 30 September 2026. Both count cars, but their coverage differs slightly. The 27% is the same renewal proxy as above.
- Age is an approximate expiry date. Cars bought used, renewed early or registered late shift their timing. The age table cannot separate Category A from B.
- The supply and price link is an association. Using twelve-month changes, the rank correlation between supply and premiums is about −0.5 for Category A and −0.55 for Category B over April 2002 to October 2026, and similar outside July 2008 to June 2010 and after 2012. It does not measure how much a given change in supply moves prices.
- The jobs tests. Quarterly, April 2002 to September 2026, without April to June 2020. We regressed the one-year change in each category’s premium on the one-year change in the unemployment rate, with the change in quota as a control. Separately, we tested whether changes in unemployment over the previous one, two or four quarters came before premium changes. We fixed the tests before running them. No full-sample result held up after adjusting for the number of tests. At the main four-quarter horizon, the earlier-unemployment results pointed the other way. Retrenchment numbers gave the same direction as unemployment. Our earlier tests of STI and S&P 500 returns were also inconclusive.
- The renewal calculator is simple arithmetic. It spreads each cost evenly over the years kept and ignores interest, which favours options that need less cash now. It assumes the current car is between nine and ten years old on a COE from before February 2023.
Sources: where every figure comes from
- Bidding results, 2010 onwards — COE bidding results on data.gov.sg, including the first November 2026 exercise of 4 November. Contains information from COE Bidding Results / Prices accessed on 5 November 2026 from data.gov.sg, which is made available under the terms of the Singapore Open Data Licence version 1.0.
- Bidding results, 2002 to 2009 — LTA archive tables for 2000 to 2004 and 2005 to 2009. Monthly prices average each month’s exercises. There was no bidding in April to June 2020.
- Car ages — LTA monthly age distribution, table at 30 September 2026, excluding tax-exempt and off-road vehicles; annual age tables for the 2016 to 2025 renewal proxy.
- Deregistrations — LTA annual and monthly tables.
- Quota for November 2026 to January 2027 — LTA news release of 26 October 2026 and its annex: 7,134 Category A and 5,707 Category B certificates over six exercises, 0% vehicle growth for Categories A, B and D until 31 January 2028. The extra certificates injected this quarter go to Categories C and D.
- Renewal rules and the PQP — LTA OneMotoring, COE renewal and PARF and COE rebates, checked 5 November 2026. PQP for November 2026 from LTA’s COE results table.
- Renewals and supply — Ministry of Transport, reply on COE renewal duration, 14 January 2026.
- Supply brought forward — LTA circular of 8 May 2023, about 6,000 guaranteed deregistrations of five-year renewals released early; LTA announcement of 29 October 2024 of up to about 20,000 additional COEs from February 2025.
- EV incentives — LTA announcement of 8 September 2025, which also says LTA expects a short-term increase in COE prices.
- Category A and B merger — LTA consultation paper, open 8 October to 2 November 2026; Ministry of Transport, reply of 3 November 2026, which says no decision has been made.
- Loan limits — MAS motor vehicle loans, and the joint announcement of 29 October 2026 extending the limits to individually owned private-hire cars from 30 October 2026. The February 2013 restrictions are in MAS’s 2013 release.
- Unemployment — Ministry of Manpower, total unemployment rate, end of period, quarterly, seasonally adjusted: SingStat Table Builder table M182342, data updated 30 October 2026. Contains information from that table accessed on 5 November 2026 from SingStat Table Builder, which is made available under the terms of the Singapore Open Data Licence version 1.0.
- Retrenchments (sensitivity test only) — Contains information from Number of Retrenched Employees - Quarterly accessed on 5 November 2026 from data.gov.sg, which is made available under the terms of the Singapore Open Data Licence version 1.0.
Every supply path, the renewal proxy, the windows and the tests are our computation from the public tables above. Nothing here is an LTA, MOM or SingStat forecast or analysis.
This is general information about how COE supply and prices have behaved, not advice about your circumstances. It does not recommend buying, renewing or selling any car.